The blame-game and climate conspiracies immediately run hot in the press and social media whenever there are major bushfires, floods, storms or other natural catastrophes. Some of the language is toxic.
Many commentators quickly find an expert opinion, a slogan, a website, an article in the newspaper, or quote the “settled science“ pointing to the impending crisis… or not…
But it seems to me that the answers are rarely as straightforward and one dimensional as many would hope… or claim. Climate Change often being the most convenient and simplistic explanation for just about every natural disaster.
Don’t get me wrong… I’m not a climate change denier… but, like lots of people, I’ve become a bit sceptical and desensitised to the daily deluge of doomsday prophecies.
And there is so much material out there too, some of it is very confusing, some seems very biased and selective, often with a predetermined outcome, depending on your point of view. I readily admit I’m not an expert either.
However, this document published in 2019 by Sarah Harris from the Country Fire Authority (CFA) and Chris Lucas from the Bureau of Meteorology (BOM) seems very balanced and makes some important points.
In Summary.
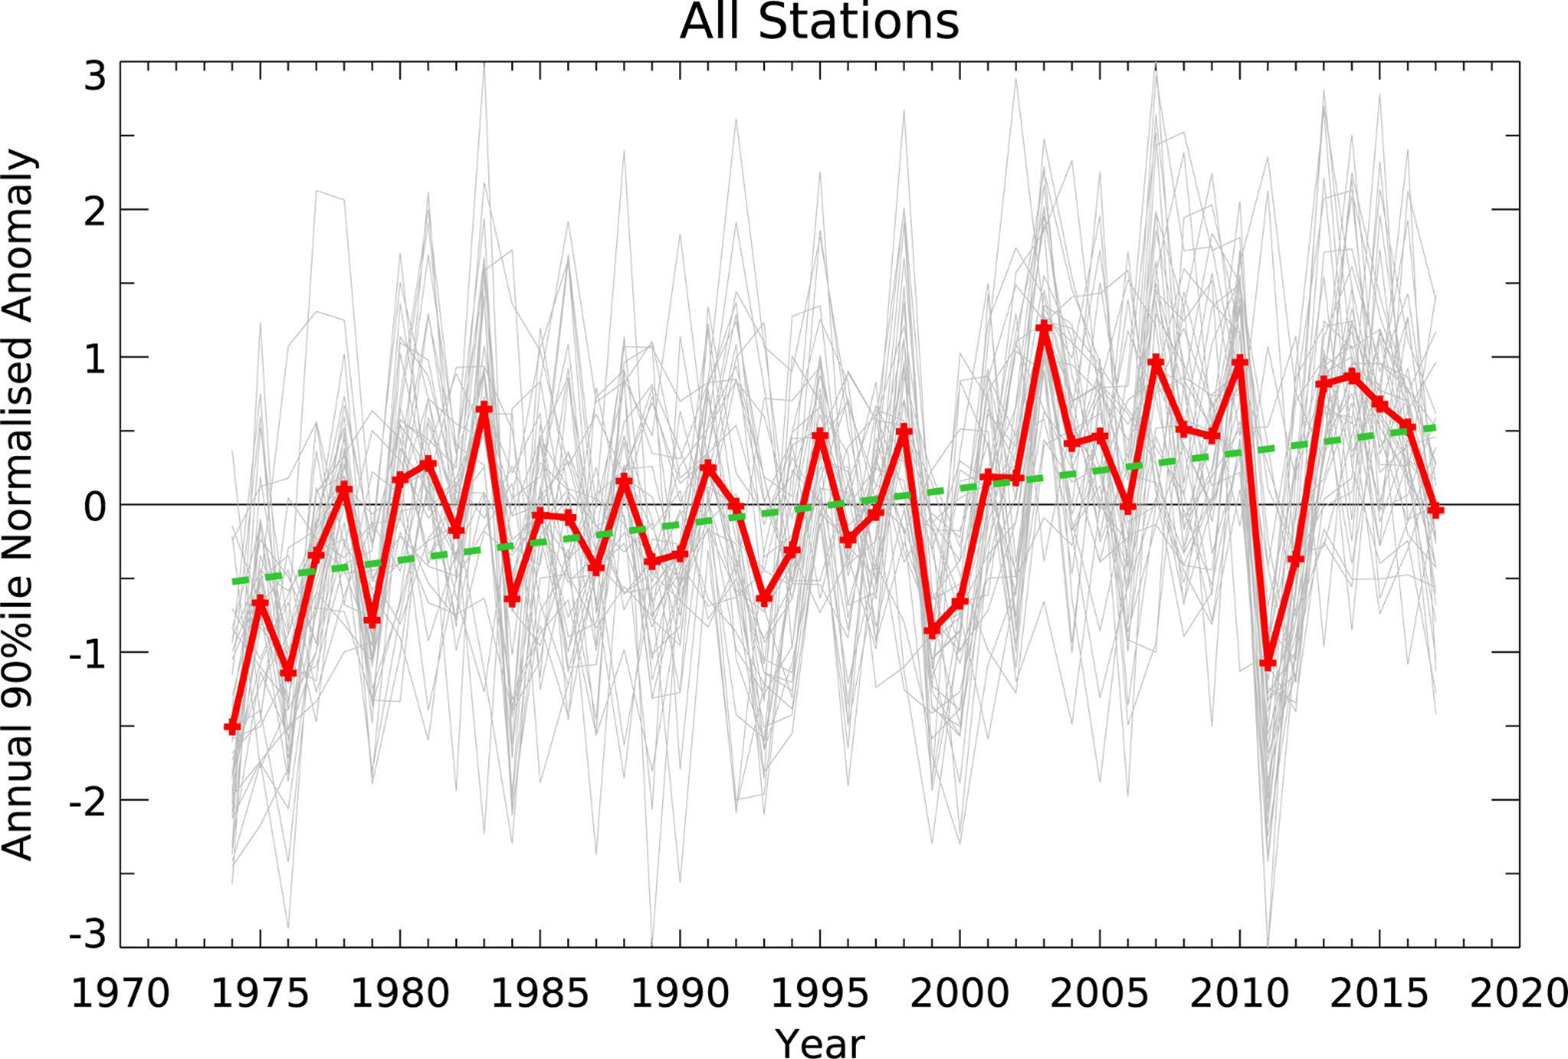
The researchers looked at the weather data from 39 BOM stations across Australia from 1973 to 2017 – admittedly only 44 years – but which, by pure coincidence, neatly straddles my career as a Victorian forest firefighter.
For the Victorian region, the BOM sites included Sale, Mildura, Laverton, Mt Gambier, Launceston and Melbourne Airport.
They then examined seasonal variations in the MacArthur Forest Fire Danger Indices (FFDI), which are a function of the drought index, rainfall, temperature, relative humidity and wind.
The authors also examined the relationship of FFDI with El Niño, the Southern Annual Mode (SAM) and the Indian Ocean Dipole (IOD).
It’s a bit of a slog to read but the main study findings were:
- There is a lot of variation (noise) in the data.
- The trend of FFDI over the 44 years is slightly upwards.
- In Victoria, fire activity (i.e. annual number of fires and total area burned) is strongly correlated to the annual accumulated FFDI.
- For Victoria, the number of days with an FFDI over 25 has increased by nearly 50%.
- For most of Australia, particularly the eastern seaboard, fire weather is strongly influenced by El Niño.
- But there are variations to this general rule. For NSW, particularly the central coast, a negative SAM is a big influence. Spring conditions are the key.
- For Victoria and Tasmania, the impact on FFDI is increased with a positive Indian Ocean Dipole.
Importantly, the authors propose, but do not conclude, that climate change may be the primary driver of higher mean temperatures and a shift in large scale rainfall patterns.
S. Harris, G. Millsa, and T. Brown (2019). Victorian fire weather trends and variability. International Congress on Modelling and Simulation, Canberra https://mssanz.org.au/modsim2019/H7/harris.pdf
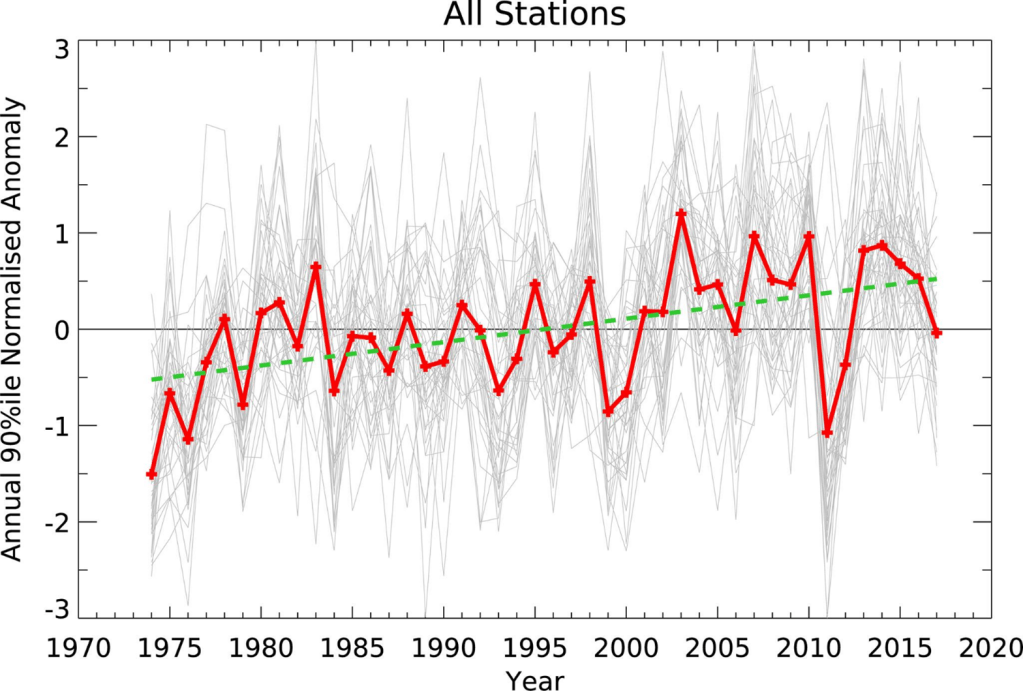
Source: Sarah Harris & Chris Lucas (2019). Understanding the variability of Australian fire weather between 1973 and 2017. PLoS ONE 14(9): e0222328. https://doi.org/10.1371/journal.pone.0222328

